In machine learning classification problems, simply looking at "Accuracy" can be dangerously misleading—especially with imbalanced datasets. If 99% of your emails are regular mail and 1% are spam, a model that blindly guesses "Not Spam" every single time will achieve 99% accuracy while failing entirely at its actual purpose.
Enter the Confusion Matrix: a table that breaks down the granular performance of a classification algorithm.
Visualizing the Matrix
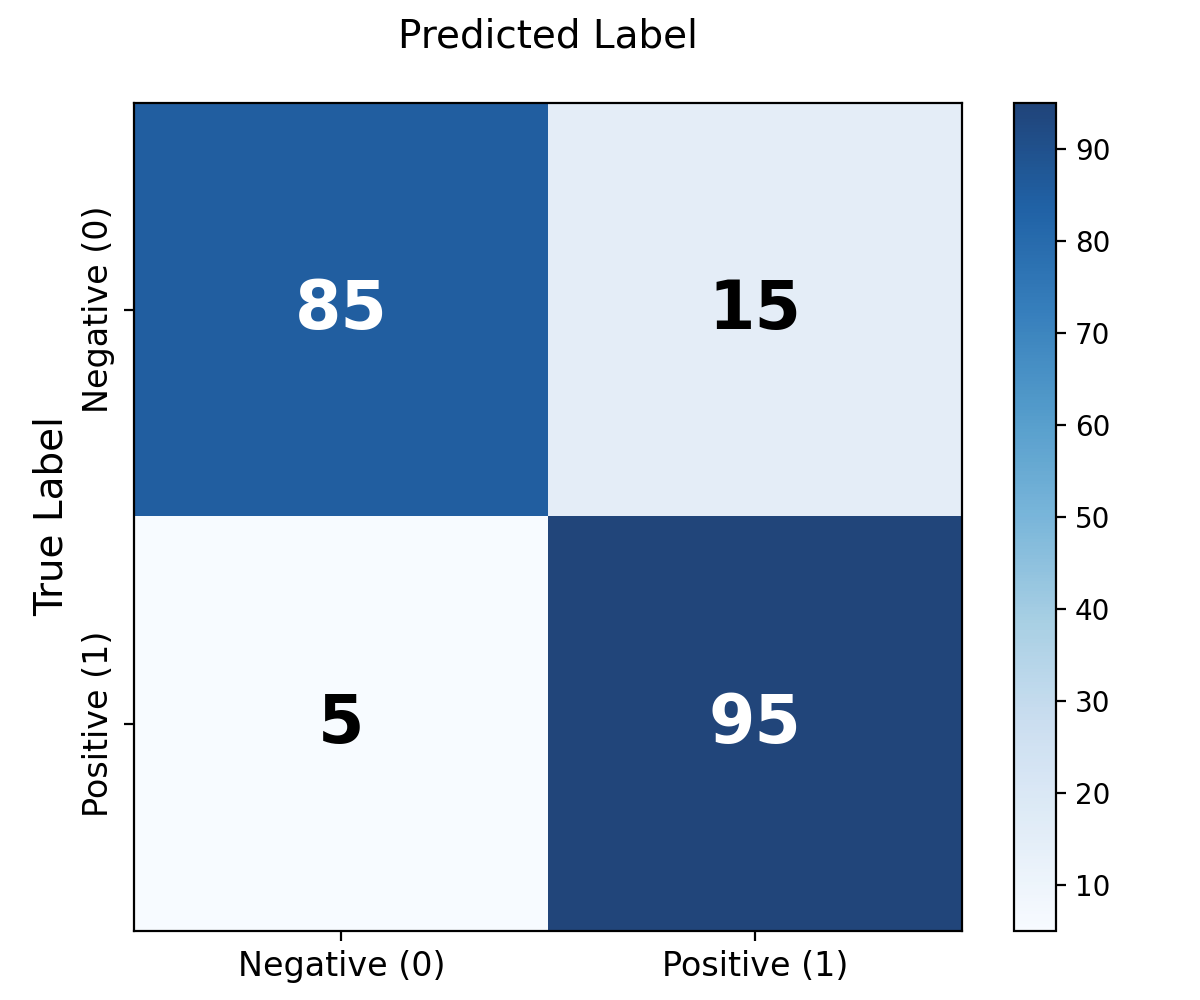
A standard confusion matrix represents a simple 2x2 grid when dealing with binary classification. The columns represent the predicted classes output by our model, and the rows represent the actual ground truth.
- True Positives (TP): The model predicted POSITIVE, and the truth was POSITIVE. (e.g., correctly caught the spam email).
- True Negatives (TN): The model predicted NEGATIVE, and the truth was NEGATIVE. (e.g., correctly let the normal email through).
- False Positives (FP): The model predicted POSITIVE, but the truth was NEGATIVE. Often called a "Type I Error". (e.g., normal email sent to the Spam folder).
- False Negatives (FN): The model predicted NEGATIVE, but the truth was POSITIVE. Often called a "Type II Error". (e.g., dangerous spam virus ends up in your main inbox).
Derived Metrics
From these four quadrants, data scientists derive significantly more robust metrics:
- Precision $\left( \frac{TP}{TP + FP} \right)$: Out of all the positive predictions the model made, how many were actually correct? Crucial when False Positives are costly.
- Recall / Sensitivity $\left( \frac{TP}{TP + FN} \right)$: Out of all the actual positive cases in the real world, how many did the model find? Crucial when False Negatives are dangerous (like cancer detection).
- F1-Score: The harmonic mean of Precision and Recall. It provides a single benchmark score to evaluate models that balance False Positives and False Negatives equally.
Python Example: Sklearn Confusion Matrix
from sklearn.metrics import confusion_matrix
import seaborn as sns
import matplotlib.pyplot as plt

# Ground truth vs Model predictions
y_true = [0, 1, 0, 1, 0, 1, 0, 0, 1, 0]
y_pred = [0, 1, 0, 0, 0, 1, 1, 0, 1, 0]

cm = confusion_matrix(y_true, y_pred)

# Visualizing using Seaborn
sns.heatmap(cm, annot=True, fmt='d', cmap='Blues')
plt.xlabel('Predicted')
plt.ylabel('Ground Truth')
plt.title('Confusion Matrix Heatmap')
plt.show()